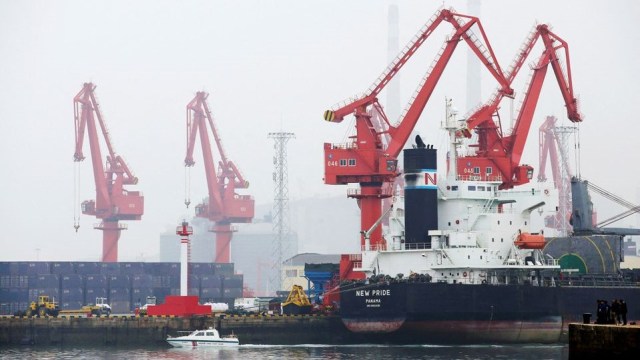
Saudi Arabia retained its top ranking in Chinese oil supplies in 2021, with supplies up 3.1% over 2020, and increased its share to 17% of total Chinese imports, customs data showed.
By Reuters – Chen Aizhu and Muyu Xu
Jan 20, 2022
China brought in 87.58 million tonnes of crude oil from the kingdom, or an equivalence of 1.75 million barrels-per-day (bpd), data from the General Administration of Customs showed on Thursday. That compares to 84.92 million tonnes in 2020, when Saudi Arabia held 16% of the Chinese market.
The expanded market share by the top OPEC exporter came as it boosted sales to national refiners and bolstered by demand from private mega refiners Zhejiang Petrochemical Corp and Hengli Petrochemical.
Russia came in second, increasing the gap with Saudi Arabia, as supplies contracted 4.7% to 79.65 million tonnes, or 1.59 million bpd, weighed down by weaker demand from China’s independent refiners.
Shipments from Iraq came in third and fell 10% on the year to 54.13 million tonnes.

Brazil dropped to No.7 last year versus No.4 in 2020, with supplies down 28% to 30.28 million tonnes, also due to reduced appetite from small independent plants.
Under a broad campaign to rein in surplus refining capacity and cut carbon emissions, the Chinese government last year introduced measures such as cutting import quotas and slapping a hefty tax on imports of blending fuels.
Imports from Oman and Malaysia gained 18% and 50%, respectively.
Reuters reported shipments from Iran and Venezuela were passed on as originated from Oman and Malaysia due to U.S. sanctions.
China’s customs data on Thursday showed the country brought in its first imports of Iranian crude oil in a year in December despite ongoing sanctions by the United States government.
Officially, Chinese customs data has consistently not shown any imports from Venezuela.
Thursday’s data showed U.S. supplies plunged 42% to 11.47 million tonnes.
The table below shows import details by country, in metric tonnes. Volumes during January-December period and the percentage changes are calculated by Reuters.
|
Country
|
December
|
yr/yr % change
|
Jan-Dec
|
yr/yr % change
|
|
Russia
|
7,236,537
|
17.4
|
79,654,884
|
-4.7
|
|
Saudi Arabia
|
6,623,516
|
-4.5
|
87,576,703
|
3.1
|
|
Iraq
|
5,011,624
|
57.7
|
54,130,343
|
-10
|
|
Angola
|
4,036,097
|
5.5
|
39,163,873
|
-6.3
|
|
UAE
|
3,726,237
|
408.7
|
33,825,312
|
8.6
|
|
Oman
|
3,622,215
|
115.5
|
44,789,938
|
18.4
|
|
Malaysia
|
3,051,600
|
207.6
|
18,738,138
|
49.6
|
|
Brazil
|
2,135,524
|
-0.7
|
30,280,184
|
-28.2
|
|
Kuwait
|
1,934,434
|
-39.2
|
30,163,604
|
9.7
|
|
United States
|
573,572
|
-84.1
|
11,471,883
|
-41.9
|
|
Irán
|
260,312
|
-49.8
|
260,312
|
-93.4
|
|
Venezuela
|
N/A
|
N/A
|
N/A
|
N/A
|
Reporting by Chen Aizhu and Muyu Xu; Editing by Shounak Dasgupta
…
Read More: Reuters – Saudi Arabia expands share in China oil market, Russia lags
…

